In this post I’ll look at how to know what visitors are doing on your site in a whistlestop tour of Google Analytics.
First things first, if you haven’t already got it installed, go to http://www.google.com/analytics/ to get it up and running. Google Analytics can provide you with more information than you thought possible and also be a bit overwhelming. But unless you’re a marketing wizard, the basics are probably enough for most people, so don’t worry!
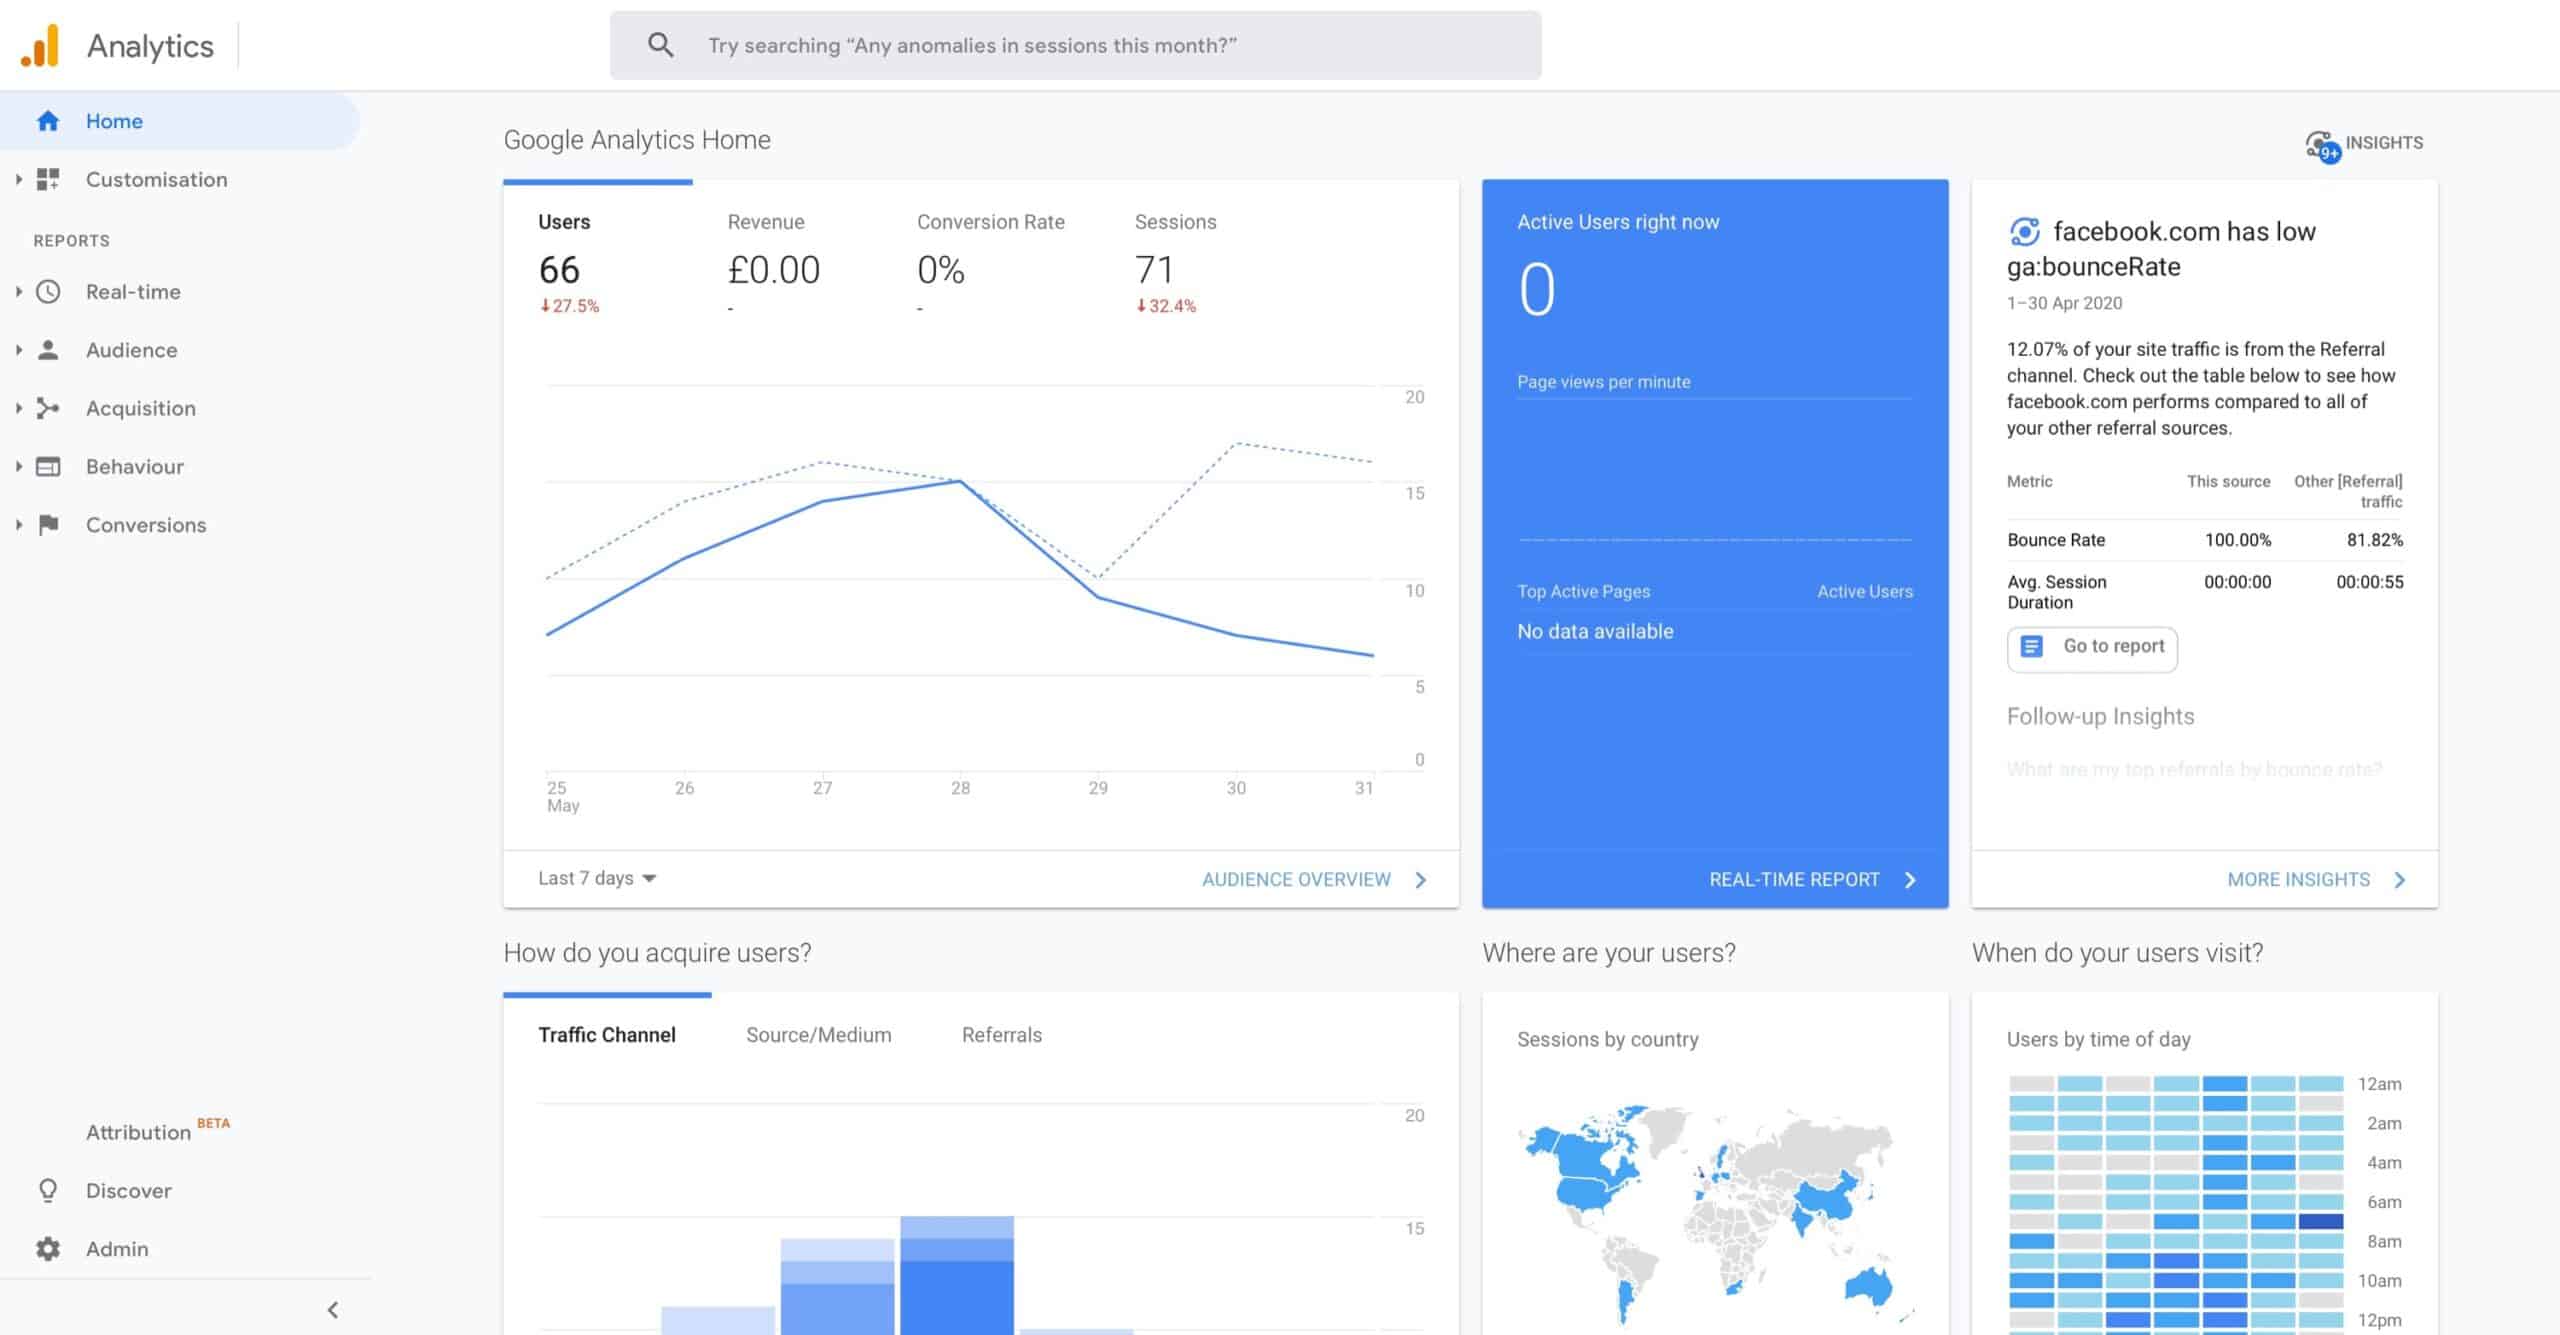
Home – A brief overview of your site performance
This is the first page you see when you log in. It shows you the “headline” figures of your site. You can customise it so it shows you the headlines that you’re interested in.
Audience – How often your visitors return to your site
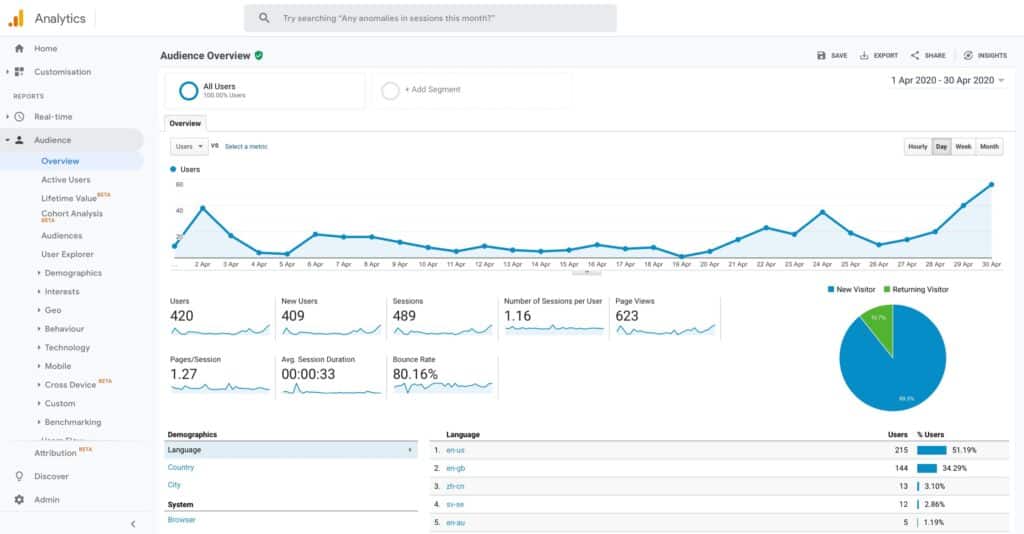
This section tells you about the people who visited your site. You can drill down to get more info using the options on the left. Consider: are people spending long enough on my site? Are they exploring enough pages? Is the ratio of new vs returning customers OK?
Acquisition – Know where your visitors come from
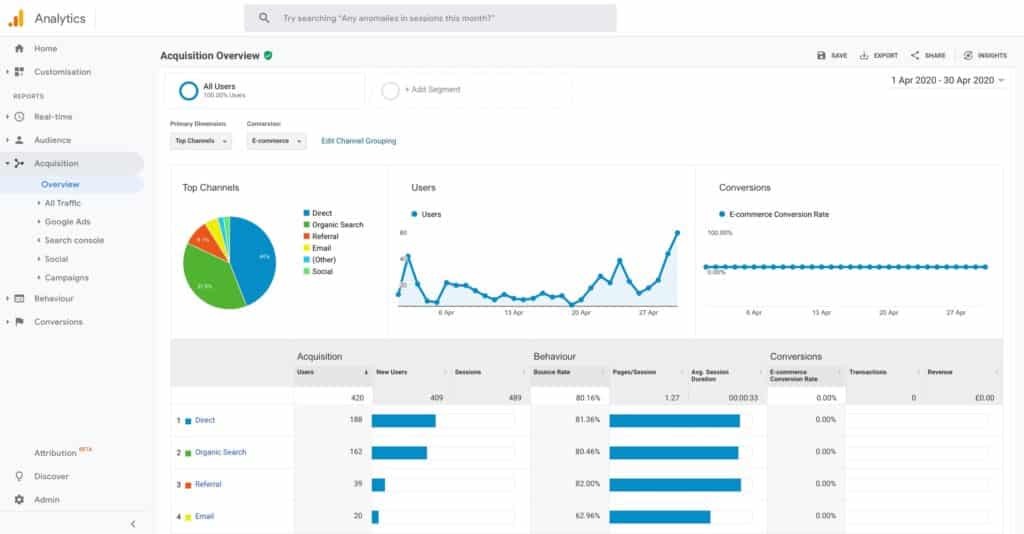
This section shows you how people are finding your site. Using this section tells you if the advert you paid for was worthwhile; whether the guest blog post you wrote got a good response etc etc.
Behaviour – Which pages visitors spend time on
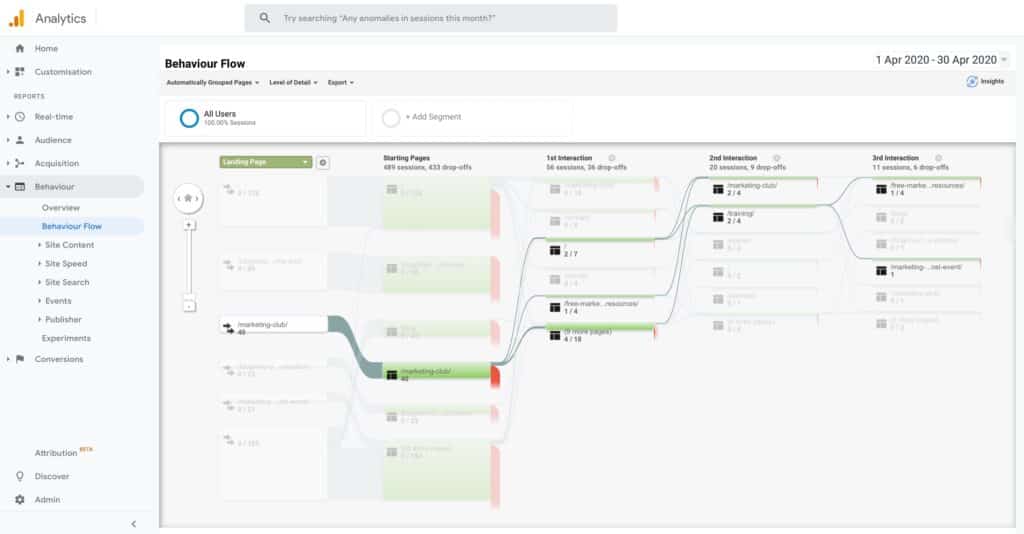
In the behaviours tap you get to see which pages people have been visiting, where they came into your site and where they left it. Consider: are people leaving on the “right” page? Are the pages you want people to read being read?
Staying in the Content section, is Behaviour Flow. It shows you which pages people initially land on and then which pages they visit next. Are they doing what you want? Is there a clear structure that people are following or not?
Tips and tricks
Changing the date range
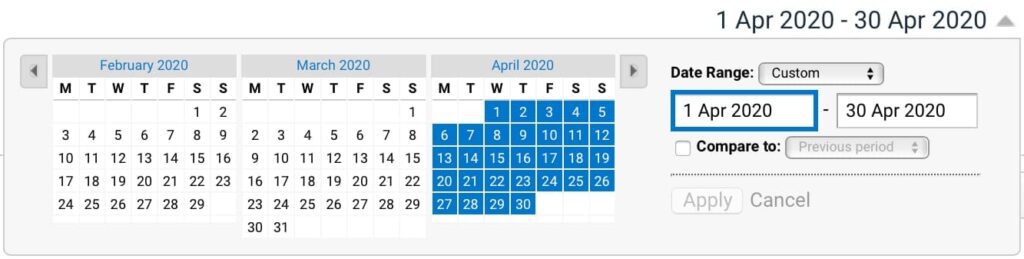
By default the data show is from the last seven days. You can change the range on (almost) every page by clicking on the date range to reveal a drop down date picker. You can change this so you can look at a single day, a week, a year: whatever range you want. Pro tip: Clicking on a month name will select that entire month.
You can also overlay two periods in ‘Compare to’, so you can look at trends month on month, year on year etc. It’s doing the same thing with your visitor numbers as you’d do with your sales figures.
Setting a Conversion Goal to track success
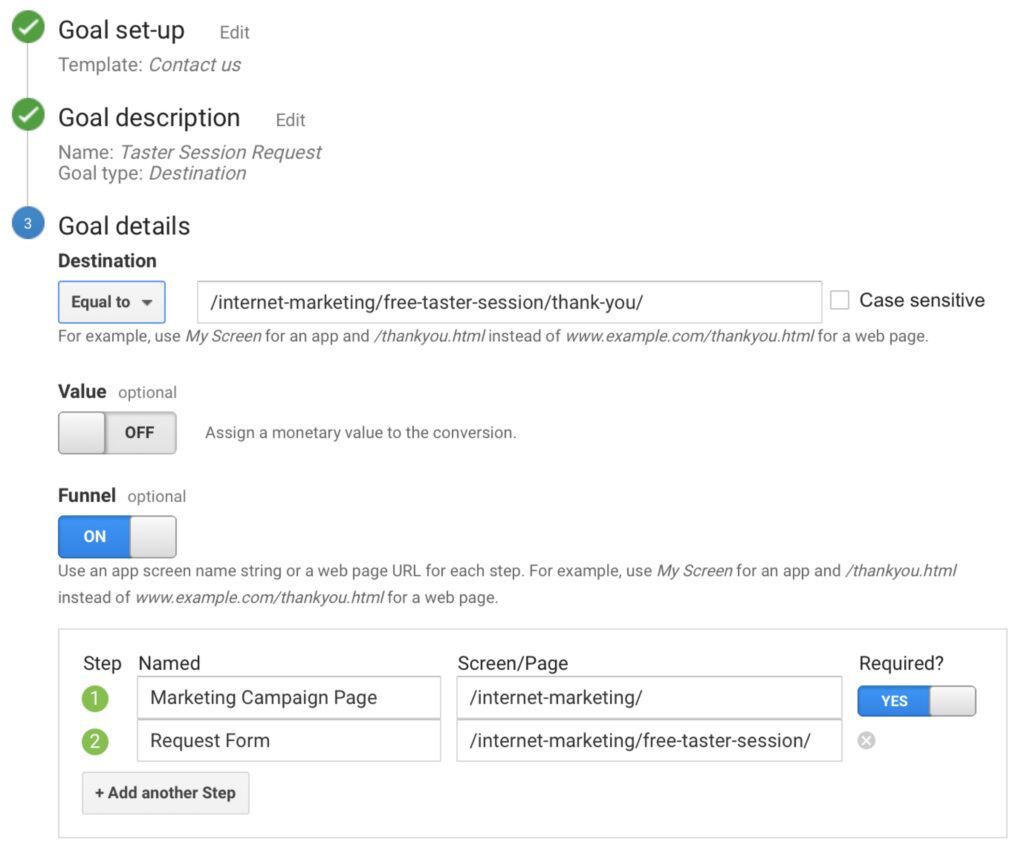
You don’t have to guess at how successful something was. You can also set up goals so you know exactly how successful your newsletter sign-up / free download / call to action was. You’ll find this in the Conversions section.
Want to know what percentage of people add something to their shopping basket and what percentage completes the purchase? What percentage of people downloaded the report or signed up to your newsletter? You can set up a goal to tell you. It means you can make decisions based on fact rather than guess work.
Google Analytics is a really powerful tool. And best of all – it’s free!
If you help getting more insight into your website and visitor behaviour, Ben created a Google Analytics walkthrough for his Marketing Club Pro Members. Find out more